
Step 1: Literature review on datasets needed for a flood analysis (Drainage, precipitation, infrastructure, coastline, tide levels, DTM)
Step 2: Delineating the study area – Create a shapefile in the arc catalogues, assign the right name, type (polygon, polyline, point). Add to the ArcGIS workspace as shown below:
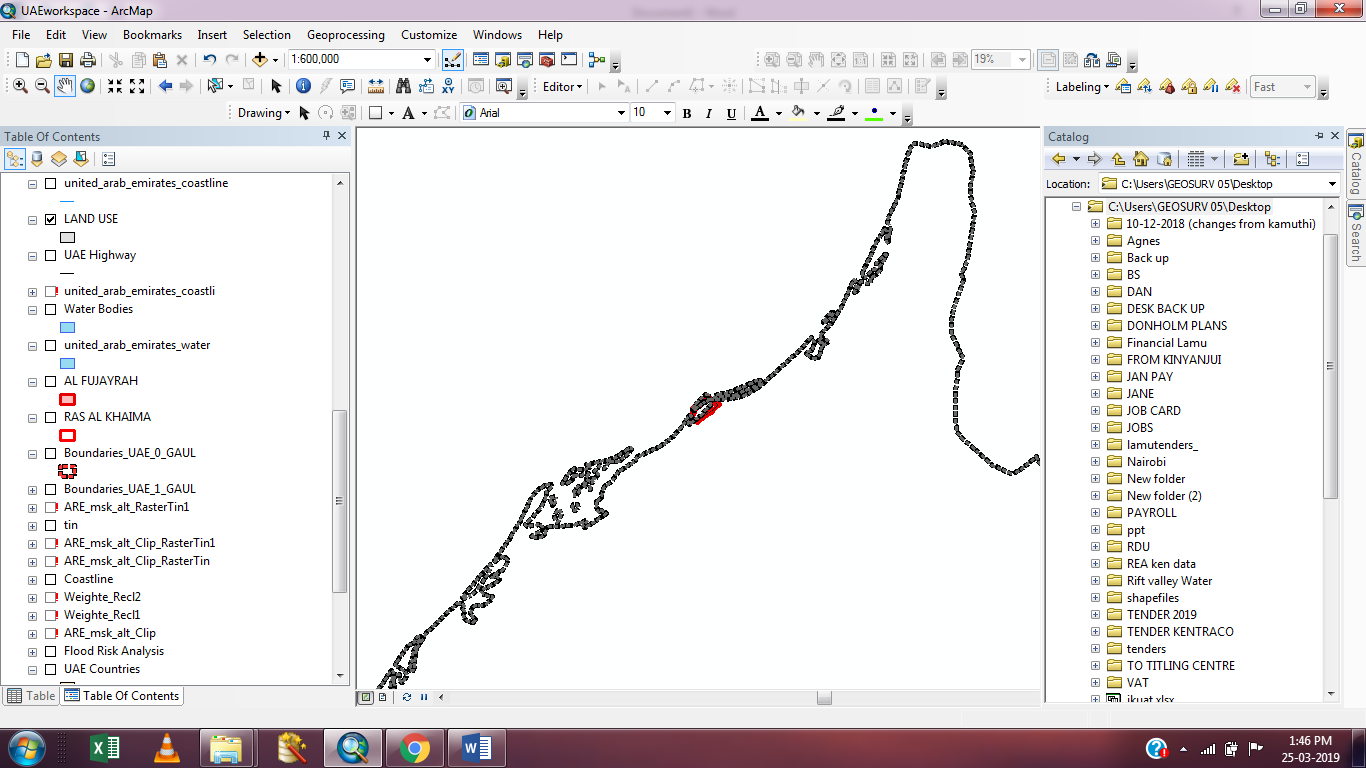
Digitize the extent needed for the boundary: For this study it was the Al Hamra village. The boundary assists in defining the flood plain area.
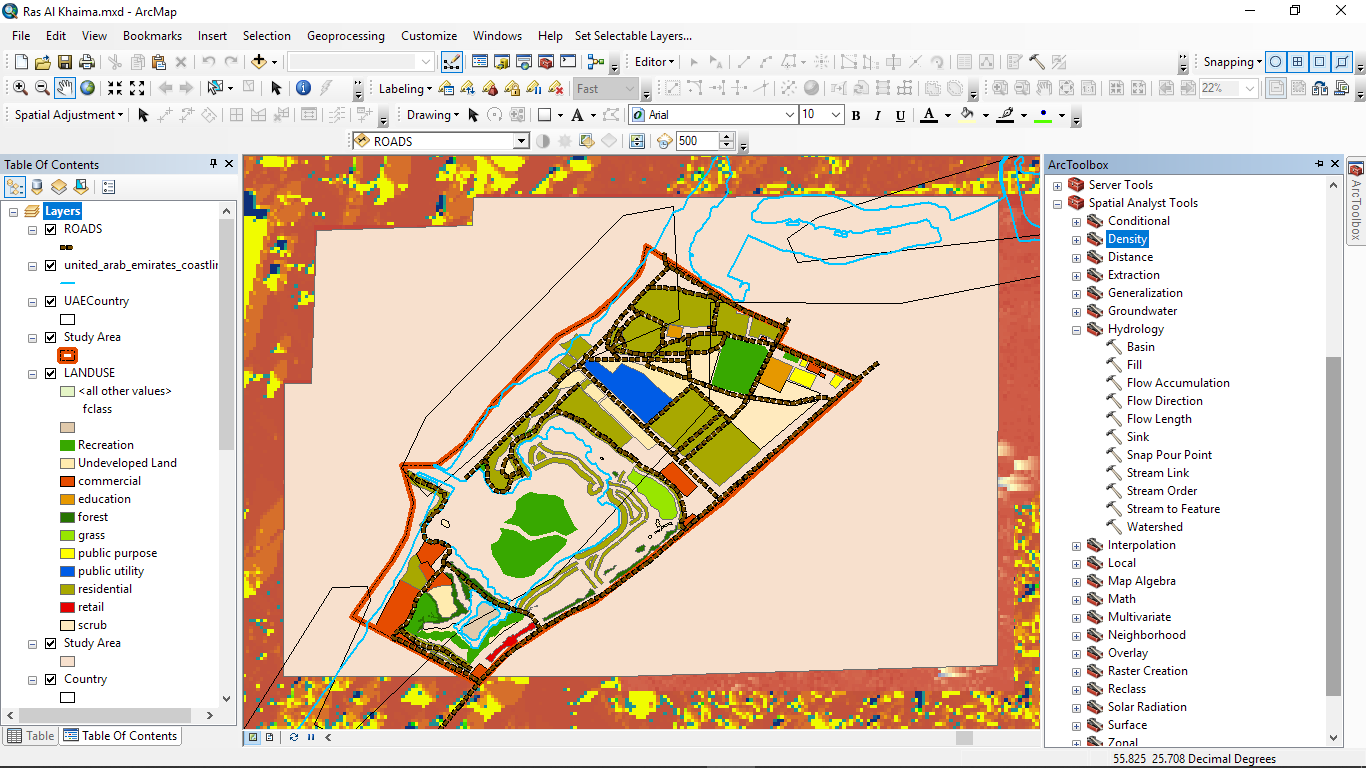
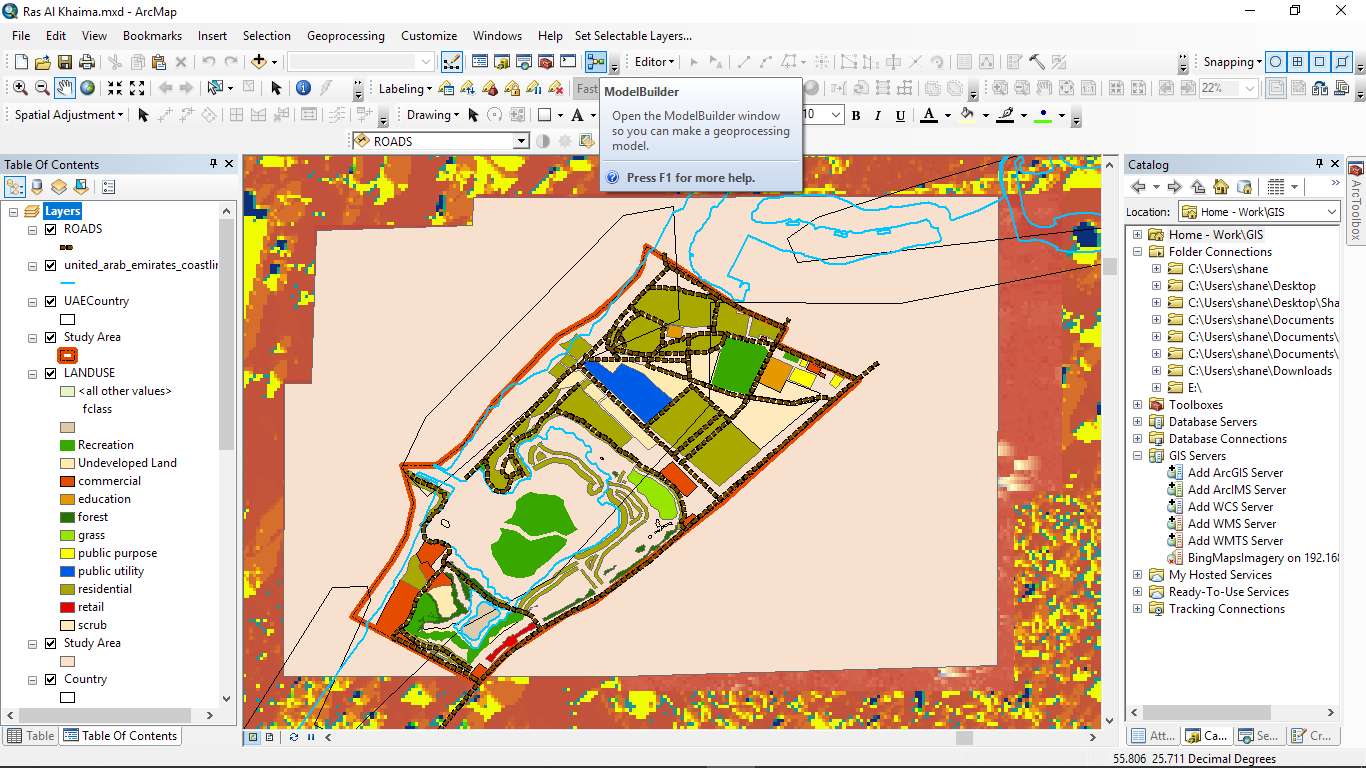
Step 3. Add a raster image of the study area background from which several datasets and analysis can be done. Among the analysis on the raster data is the flood accumulation, flood direction and watershed region using the Hydrology in Spatial Analysis tool in the Arctoolbox. This raster can be overlayed with other datasets for a more refined analysis.
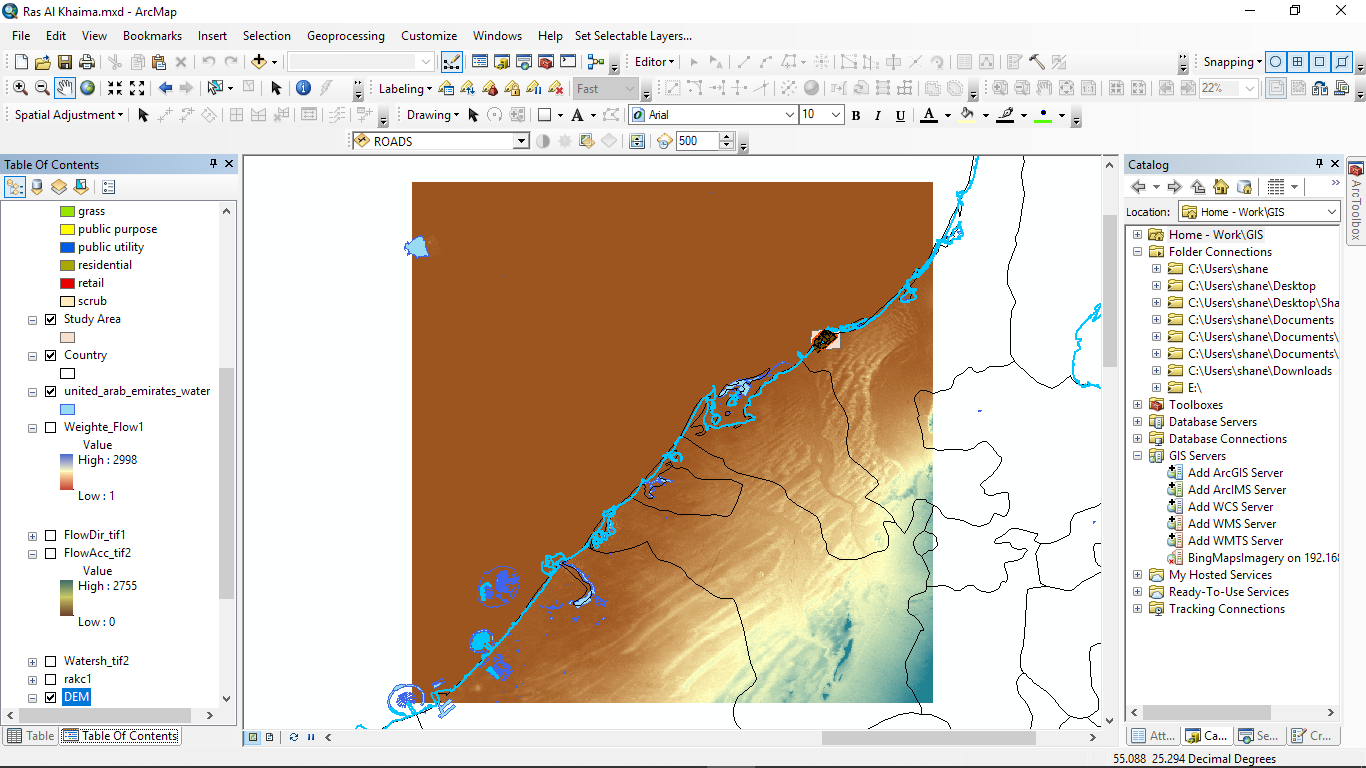
Step 4. Add the DTM raster data, downloaded from JAXA that has data on height above sea level. A raster analysis is done to generate a slope and elevation data.
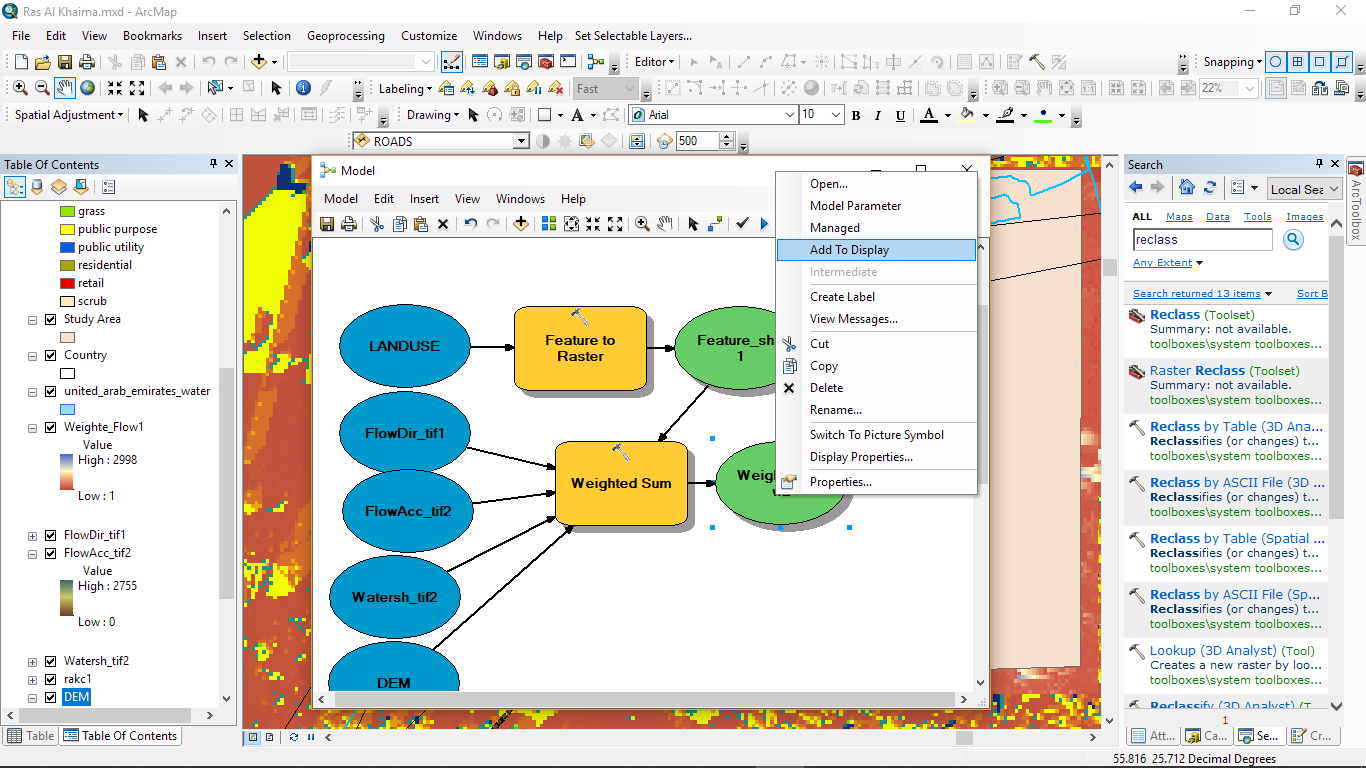
Step 5. Open the model builder:
In the model builder load different raster from the dataset generated: The slops analysis, flow analysis, reclassified raster dataset showing water bodies, buildings and infrastructure. The data is then overlayed and processed using the Weighted overlay feature. The features are assigned values based on the impact they have on the flooding levels. Right click on the weight overlay and run the command and the resultant feature is added to the workspace to be viewed. Additionally, vector data can be converted to raster by first reclassifying and then changing from feature to raster in the model builder. (To get some tools, use the search options and drag the tool into the workspace).
NB: The spatial analysis tools will assist greatly to interact with data as well as conversion tool in the Arctoolbox.

2 Comments
[…] Select using ArcPy: The following snippet demonstrates how ArcPy might be used to perform a spatial analysis in an ArcGIS environment, for instance buffering a roads layer and then selecting schools within those buffer […]
[…] suite widely used by governments, NGOs, and researchers for environmental mapping and analysis. ArcGIS offers powerful spatial analysis tools and extensive data visualization capabilities. It enables integration of field data with […]