
Spatial statistics are used to analyze the spatial distribution, patterns, and relationships of geographic phenomena. Two commonly used methods are Hot Spot Analysis and Moran’s I, both of which help detect spatial patterns in data.
Hot Spot Analysis (Getis-Ord Gi*)
Hot Spot Analysis identifies clusters of high or low values in spatial data.
- Purpose: Detect statistically significant spatial clusters of high (hot spots) and low (cold spots) values.
- How it works: Compares the local sum of a feature and its neighbors to the global sum.
- Output: Z-scores and p-values for each feature, indicating whether a location is part of a statistically significant hot or cold spot.
Use case example: Finding crime hot spots in a city or disease outbreaks.
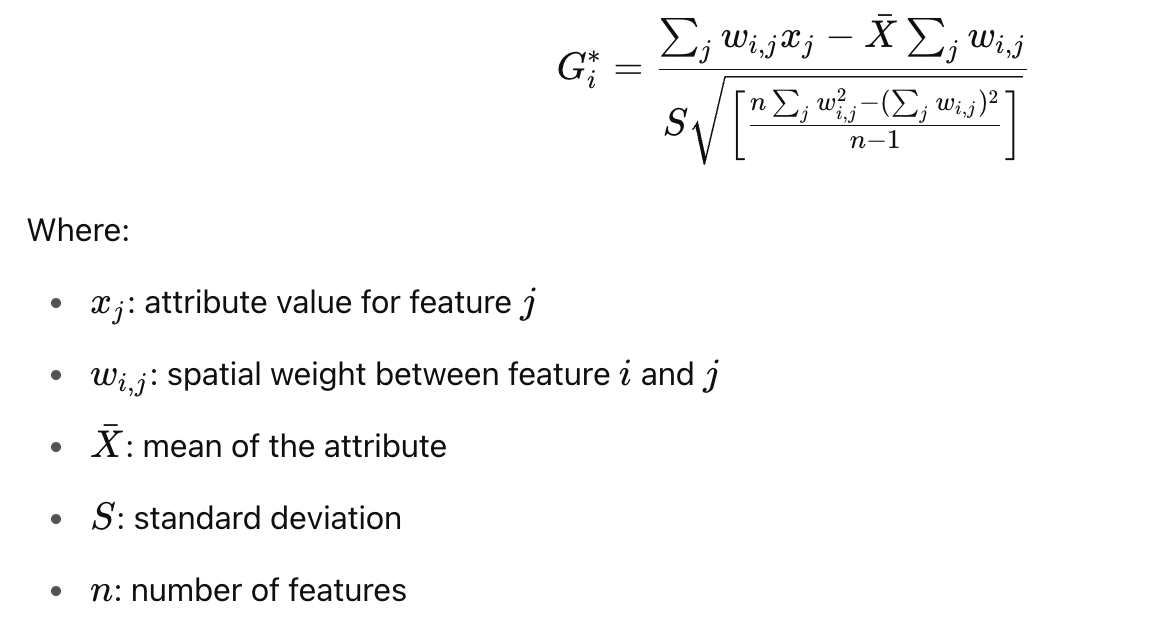
Formula (simplified):
Moran’s I
Moran’s I measures spatial autocorrelation — the degree to which a spatial phenomenon is correlated with itself in space.
- Purpose: Assess whether the pattern is clustered, dispersed, or random.
- Types:
- Global Moran’s I: One value summarizing the entire dataset.
- Local Moran’s I (LISA): Identifies local clusters and outliers.
Value range:
- +1+1+1: Strong positive spatial autocorrelation (clustering)
- 000: Random
- −1-1−1: Strong negative spatial autocorrelation (dispersion)
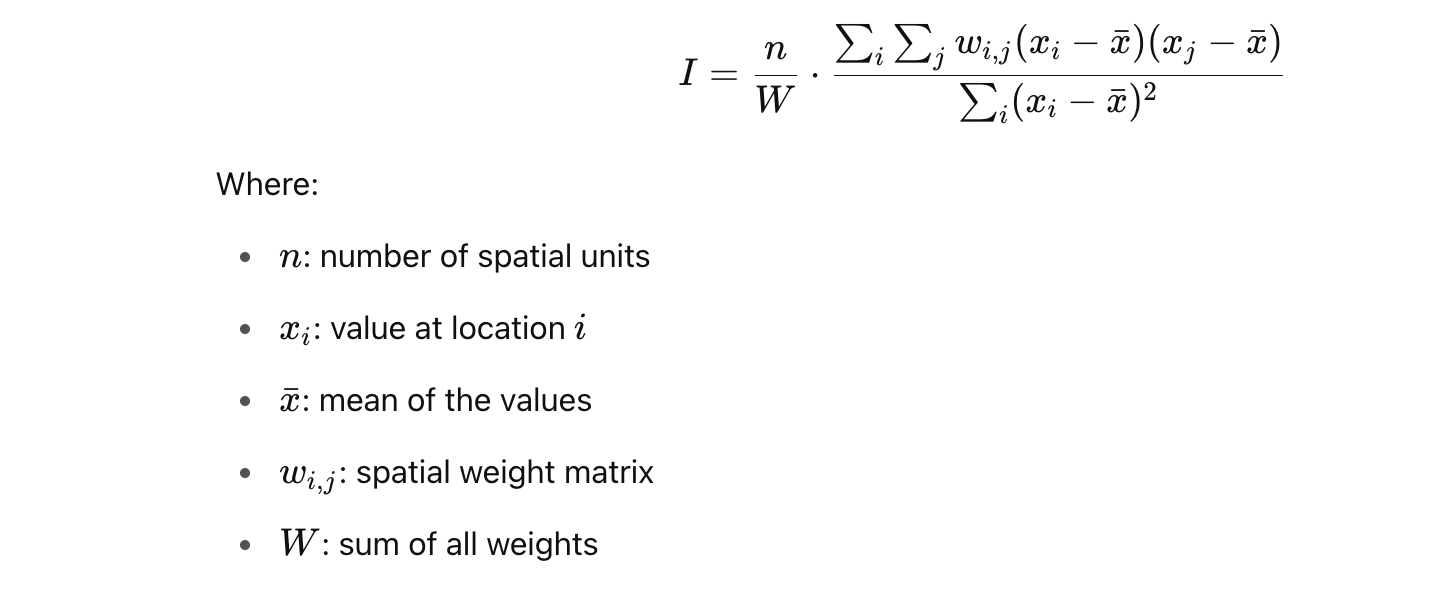
Formula (Global Moran’s I):
Use case example: Analyzing whether high house prices cluster in a city.
Tools
These analyses are commonly run using:
- ArcGIS Pro (Hot Spot Analysis, Moran’s I tools)
- QGIS with spatial statistics plugins
- R (packages like
spdep,sf,spatialreg) - Python (
PySAL,geopandas,esda)
